

Prioritizing data storytelling has become imperative for data explorers, including business users, data analysts, data miners and others aiming for intuitive analytics, analysts sharing their observations and product vendors who claim their platform tells data stories best. However, the techniques used to create stories have varied and matured substantially over time, emphasizing elegance and automation. Human beings tend to understand and remember stories better than just numbers or facts. The stakeholders and management executives find it easier to relate to data stories explaining the story behind the data instead of a chart or a series of visualizations. Data storytelling and narratives bridge the gap between data and people.
However, various data-intensive projects are often delivered with a focus on technicalities rather than people, making it both difficult to consume and challenging to relate to data points that can be utilized in creating actionable items for a functional business area. Storytelling is a bedrock of human experience and has been developed across various mediums throughout human history — from oral histories to printed books to movies and even comic books. Organizations aspire to empower their employees to use data and drive more intelligent and efficient decision-making. Despite having abundant data, many enterprises struggle to effectively integrate data within the broader range of workflows enabling decision-making. The current data flow ecosystem enables data access but falls short in supporting the organizations' diverse array of data conversations. While dashboards serve as the primary interface to data access, they often lack the expressiveness and dynamism required for meaningful data conversations and decision-making.
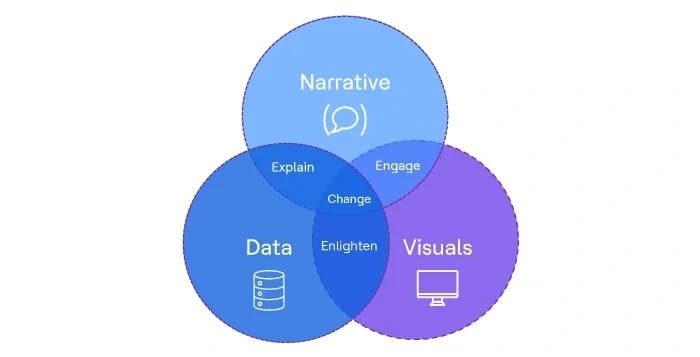
To sum up, stories are:

Traditional reporting: Where is the story?
Throughout history, storytelling has been a fundamental practice. Earlier businesses meticulously kept records of data, such as financial data, product inventory data and so on, and make informed decisions to define quantity on the basis of past sales or stock replenishment needs. Managers relied on manual analysis, compiling data into tables, then publish and send the results for use, which facilitated having an accurate idea about sales, shortagez, supply and demand. With this transition from analog to digital, data accessibility improved and the advances in computational power empowered us to better comprehend it. As we entered the beginning of the 21st century, a time of advanced IT-authored reporting systems reports or dashboards transpired and became standard tools for informing employees about the drivers impacting their business.
Despite the technological progress, the objective has remained constant — to find answers to the questions troubling the people who need to make decisions: What is at risk and why? How is my team performing? How can we increase revenue while decreasing costs? However, extracting these insights required intensive resources and tremendous investment in data infrastructure. Traditional reporting systems demanded specialized skillsets on time. Users often found themselves reliant on BI authors who were entangled and puzzled in countless requests with semi-structured, structured, raw, unfiltered, unformatted data with limited BI tools, creating delays in obtaining essential insights.
Even when those requests were met, answers came in a data table, a cube, a report or a static dashboard that often lacked a coherent narrative, leaving its consumers clueless to decipher data accurately. This led to inconsinstent interpretation of the report and hence inconsistent results. Or the story remained hidden in the data because the end user was reluctant to perform the manual work necessary to understand it. This drawback of traditional reporting led to the question: Is there a better way to disseminate and consume information? Where is the story?
Data visualization and discovery: The rise of data storytelling
With the advent of interactive data-discovery capabilities and dynamic visualizations, things have significantly improved for business owners. BI tools equipped with data discovery and storytelling features cater to the needs of business professionals, seeking greater control over their analysis and enhanced access to data. General users have become empowered to ask and answer their own inquiries, reducing reliance on IT support.
With the widespread adoption of cloud, enterprises can now initiate projects without a substantial investment. Self-service features further empower users. They can now integrate multiple data sets for more robust analysis and can leverage that to predict future outcomes. Utilizing its capabilities, users can create rich visualizations to highlight insights that remain hidden within the data or report table alone. Visualizations serve as a medium for crafting a compelling story with the data, an improvement over the limitation of static dashboards and canned reports of the past. These outdated formats were often too simplified, creating confusion due to the misrepresentation of measures and dimensions or too complicated and unable to be interpreted by the viewers. Furthermore, the story quickly became outdated as it could not be updated in real-time.
Data storytelling now contains an actual story. Anyone can share insights by creating storyboards that provide further context to the insights contained in the charts and graphs.
How to build a data story
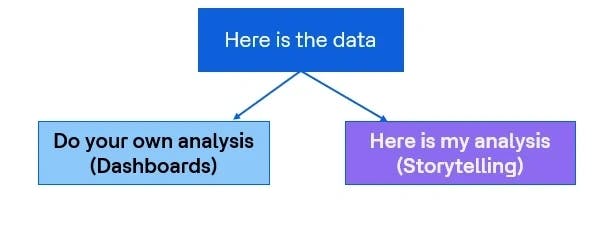
Data and dashboards serve as important decision-making catalysts within organizations. They can function as documentation, in which data enables decision making and facilitate collaboration by establishing a baseline. Moreover, they can also act as a medium for circulating information and ideas across data workers and organizational contexts. However, the most crucial role of data is to support conversations.
These data conversations can be further categorized into two types: those with data and those occurring through and around data. Conversations with data involve interactions directly between the user and their data (individual analysis work). Conversations through and around data use the data as a medium for conveying information, a story or a particular view to others. Importantly people reshape the data as a strategy for communication, anticipating the need for translation for data to jump contexts. Conversations around data often spark further questions and insights, drive actions or simply foster connections among people.
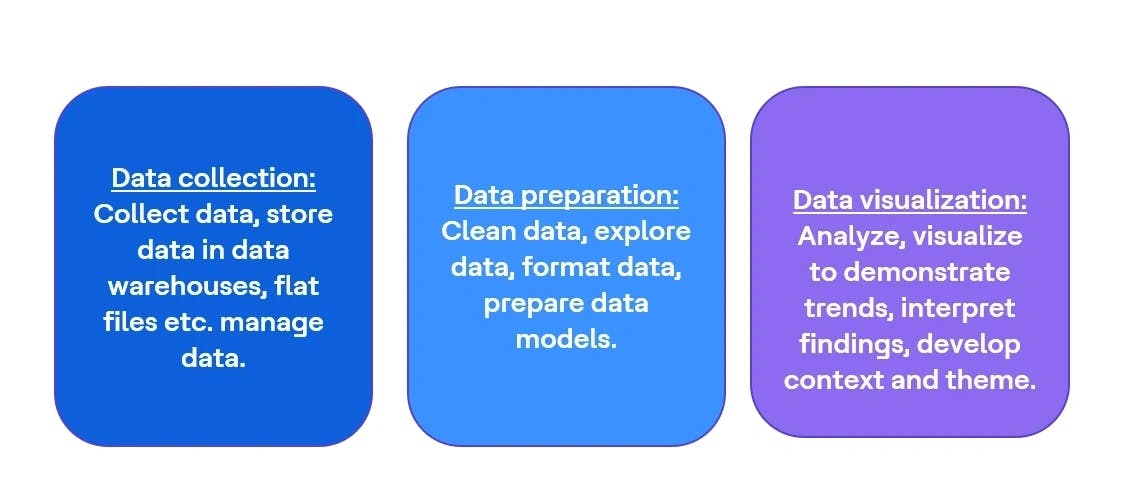
Below is a comprehensive framework of data preparation, visualization and storytelling on an enterprise scale.
Data analysts typically tackle common analysis goals, such as explaining, predicting or finding anomaly, which often align with goals of other analysts. However, the disparities might arise in their ability to dedicate time or bandwidth to do these tasks, their proficiency in data analysis techniques or their access supportive teams. Notably monitoring, lookup and summarization emerge as uniquely important for data analysts, yet are often overlooked when building tools for analysts.
Through mapping resource tasks with specific goals, we can discern how certain tasks contribute broadly to multiple objectives, while others serve more specialized purpose. For example, data might be sliced and diced (grouped, filtered and aggregated) as part of any analysis, whereas data was only modeled to predict or collaborate. Similarly, efforts to format data are typically undertaken if the goal involved circulation or discussion. Additionally, tasks encompass accessing, enriching, shaping and construction in addition to sharing data play pivotal roles in facilitating conversations through and around data.
Tableau Story Points
Tableau's Story Points feature facilitates users in crafting compelling and interactive data stories by empowering them to annotate specific visualizations in a sequential manner. This approach enriches insights by providing deeper context through an explanatory narrative.
Story Points serves as a structured framework for arranging data visualizations sequentially, enabling users to construct stories with a coherent beginning, middle and end — even with large and intricate data sets. This feature helps users to weave stories with data analysis, ensuring that their presentations remain connected to the underlying data.
The utilization of Story Points to communicate insights is far ahead on the horizon compared to when static reports were prominent. However, crafting a meaningful story still requires manual exploration of data . What if there was a way to introduce AI to help the end user uncover new insights and tell a more comprehensive and consistent story in a scalable way?
Natural language generation: Automated data storytelling
In today’s IT landscape, many organizations rely on sophisticated data pipelines and robust BI systems to fulfill the reporting needs of top management executives. The integration of AI/ML concepts in various aspects such as model building, data preparation, statistical calculations, etc. have given rise to a concept of automated data storytelling. Automation spans tasks ranging from data cleaning and formatting to statistical insight generation and Natural Language Generation (NLG), a feature that transforms data into English narratives. It is revolutionizing the data-discovery and visualization process by instantly generating natural-language insights to accompany charts and graphs, thereby helping common users in better understanding data.
There are extensions available in Tableau wto help generate natural language on dashboards. For example, Quill and Wordsmith are instances of NLG products. The insights are then rendered in intuitive, easy-to-understand language, indistinguishable from what an analyst would write.
The automation of data storytelling significantly expedites time-to-insight for those engaged in the data discovery process. These data-driven narratives adeptly identify and communicate correlations, trends and anomalies within the data, facilitating better understanding novice users for their visualizations while enabling expert users to delve deeper more efficiently.
Automated storytelling can be implemented through the components below.
- Narratives: Reports in plain English with visuals (e.g., wealth reports, patient reports)
- Infographics: Visual insights which can be delivered to your inbox (e.g., customer segments, shifts in viewership patterns)
- Comics: Engage through emotions with icons, emoticons, etc. (e.g., price or revenue forecasts)
- Videos: Insights delivered as automated videos (e.g., factor correlation, type detection)
These narratives can be seamlessly embedded into webpages and published alongside the visualizations, providing a quick and effortless mechanism of sharing findings with others — eliminating the need for manual annotations to the chart or graph. The ability to automatically unlock and convey insights via language has many benefits, such as allowing people to interact with their data in a fluid and natural way. Moreover, it reduces misinterpretation of data and ensures consistency in data sharing, eventually facilitating people to act quickly on their key findings and drive decisions.
Combining NLG with automated pattern detection and self-service data preparation has the potential to drive the user experience of next-generation smart data discovery platforms and expand the benefits of advanced analytics to a wider audience of business users and data scientists. As automated data storytelling rises, more people will be empowered to explore their data, uncover insights and maximize the impact of their work.
Conclusion
From preventing disease to comprehending natural disasters, the potential of data stories is unlimited. Envisioning the impact of billions of people narrating their experiences through numbers unveils a vast scope of idea generation, model creation, process creation and so on. Stories have always served as a universal medium for communication. Since ancient times, stories have been instrumental in conserving and transmitting information. With a data story, millions of rows can be distilled into a single narrative. Following this narrative makes it significantly easier to understand underlying dynamics. While the data can tell you what is happening, a story can explain the cause. Moreover, stories motivate action. And in today’s world of information overload, it is crucial to be able to make informed, actionable decisions with all your data.
